
How-to: Display the colourmaps availabe in Towerpy and simulate Colour Vision Deficiency (CVD).#
Daniel Sanchez-Rivas1 and Miguel A. Rico-Ramirez2
1Department of Meteorology, University of Bonn, Bonn, 53121, DE
2Department of Civil Engineering, University of Bristol, Bristol, BS8 1TR, United Kingdom
This notebook describes the process to display the colourmaps available in Towerpy.
Import relevant packages#
import matplotlib as mpl
import matplotlib.pyplot as plt
import matplotlib.colors as mcolors
import numpy as np
import towerpy as tp
---------------------------------------------------------------------------
ModuleNotFoundError                       Traceback (most recent call last)
Cell In[1], line 1
----> 1 import matplotlib as mpl
      2 import matplotlib.pyplot as plt
      3 import matplotlib.colors as mcolors

ModuleNotFoundError: No module named 'matplotlib'
Read-in the Towerpy colourmaps#
First, we’ll read the colourmaps available in Towerpy.
tpcm = list(mpl.colormaps)
tpcm[:] = [i for i in tpcm if i.startswith('tpy')]
# Create a list of Radar-related colourmaps
tp_rad_lsc = [i for i in tpcm if 'rad' in i and 'lsc' in i]
tp_rad_lc = [i for i in tpcm if 'rad' in i and 'lc' in i]

# Create a list of Diverging colourmaps
tp_div_lsc = [i for i in tpcm if 'div' in i and 'lsc' in i]
tp_div_lc = [i for i in tpcm if 'div' in i and 'lc' in i]

# Create a list of Perceptually Uniform Sequential colourmaps
tp_unfseq_lsc = [i for i in tpcm if 'useq' in i and 'lsc' in i]
tp_unfseq_lc = [i for i in tpcm if 'useq' in i and 'lc' in i]
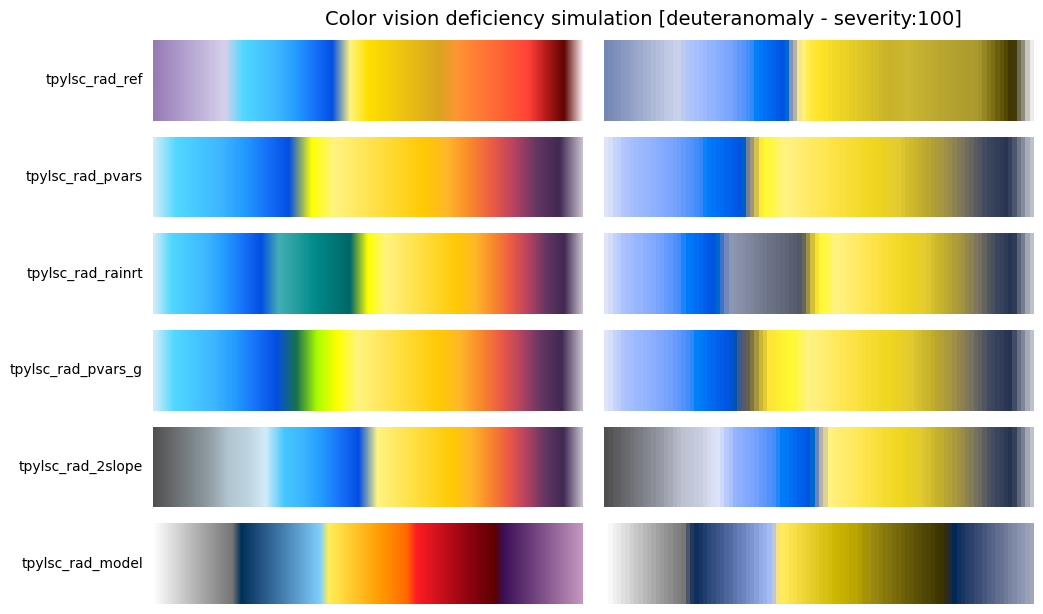
We will use Colorspacious, a powerful, accurate, and easy-to-use library for performing colourspace conversions. The cspace_convert1 function provides tools to simulate various sorts of colour vision deficiency, a.k.a. “colourblindness”. Please refer to their webpage for more details on the CVD simulation.
cm2plot = tp_rad_lsc

tp.datavis.tpy_cm.plot_color_gradients_cvd(cm2plot[:int(len(cm2plot)/2)], cvd_type='deuteranomaly',
                                           severity=100)
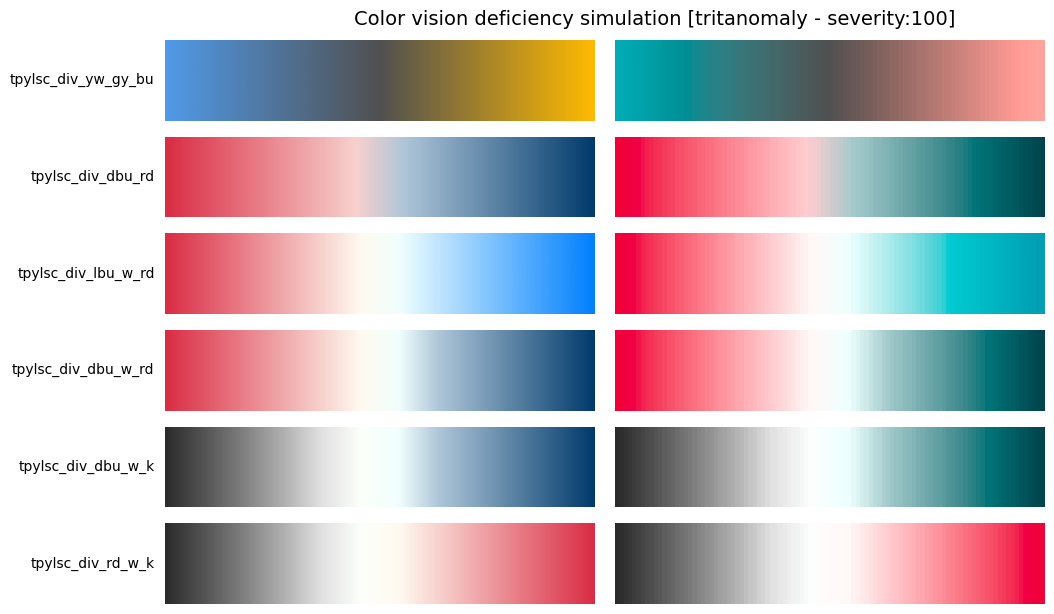
cm2plot = tp_div_lsc

tp.datavis.tpy_cm.plot_color_gradients_cvd(cm2plot[:int(len(cm2plot)/2)], cvd_type='tritanomaly',
                                           severity=100)
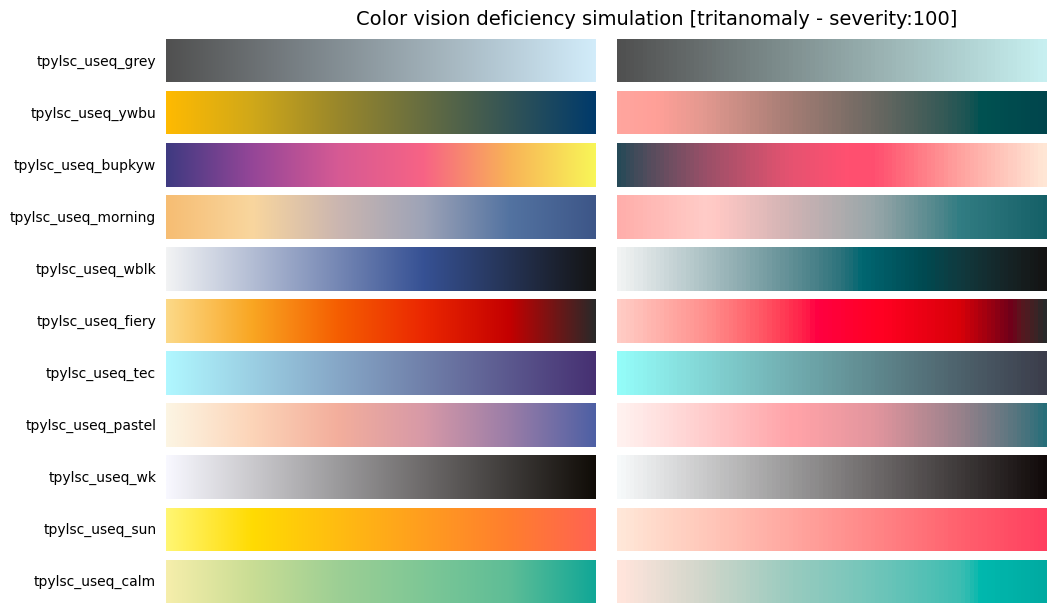
cm2plot = tp_unfseq_lsc
tp.datavis.tpy_cm.plot_color_gradients_cvd(cm2plot[:int(len(cm2plot)/2)], cvd_type='tritanomaly',
                                           severity=100)
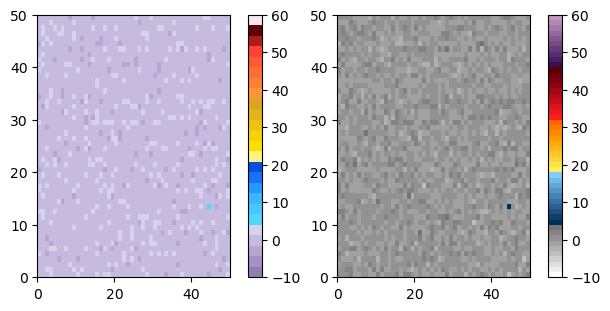
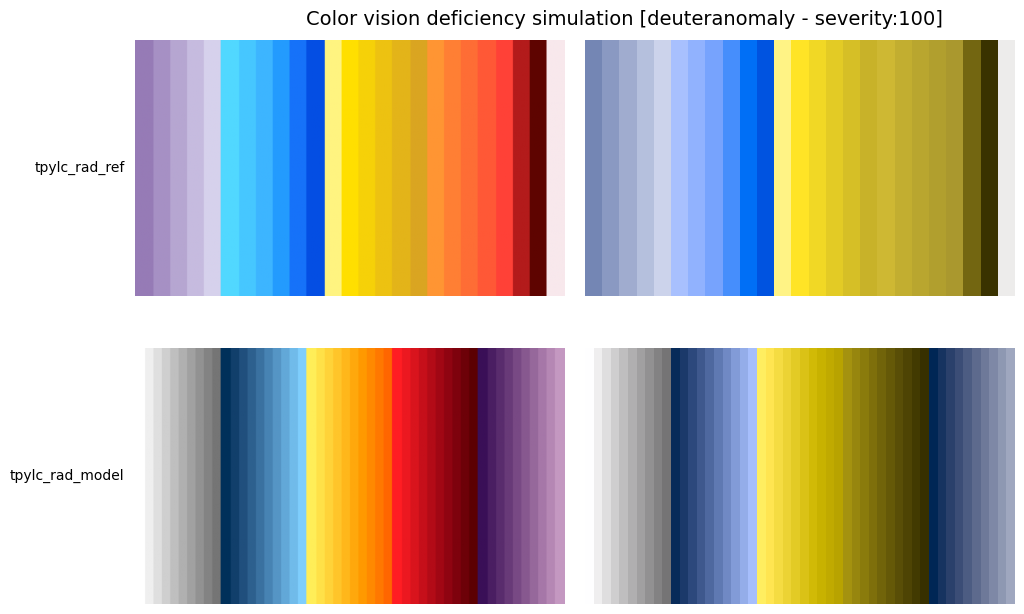
Finally, we plot the tpylc_rad_ref colourmap. This cmap is used in Towerpy to represent the radar reflectivity.
tp.datavis.tpy_cm.plot_examples([tp_rad_lc[0], tp_rad_lc[5]], vmin=-10, vmax=60)


tp.datavis.tpy_cm.plot_color_gradients_cvd([tp_rad_lc[0], tp_rad_lc[5]],
                                           cvd_type='deuteranomaly', severity=100)
References#
[1] Colorspacious developers (2015) https://colorspacious.readthedocs.io/en/latest/tutorial.html#simulating-colorblindness