How-to: Display the colourmaps availabe in Towerpy.#
Daniel Sanchez-Rivas1 and Miguel A. Rico-Ramirez2
1Department of Meteorology, University of Bonn, Bonn, 53121, DE
2Department of Civil Engineering, University of Bristol, Bristol, BS8 1TR, United Kingdom
**This notebook describes the process to display the colourmaps available in Towerpy.
Import relevant packages#
import matplotlib as mpl
import matplotlib.pyplot as plt
import matplotlib.colors as mcolors
import numpy as np
import towerpy as tp
---------------------------------------------------------------------------
ModuleNotFoundError                       Traceback (most recent call last)
Cell In[1], line 1
----> 1 import matplotlib as mpl
      2 import matplotlib.pyplot as plt
      3 import matplotlib.colors as mcolors

ModuleNotFoundError: No module named 'matplotlib'
Classify the colourmaps#
First, we’ll read the colourmaps available in Towerpy.
tpcm = list(mpl.colormaps)
tpcm[:] = [i for i in tpcm if i.startswith('tpy')]
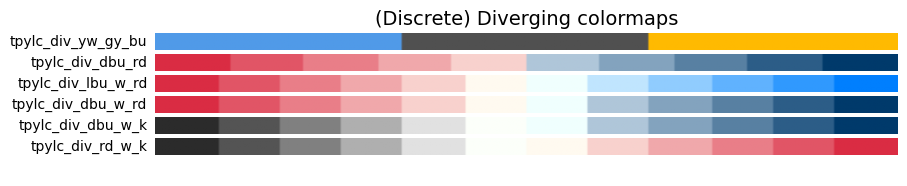
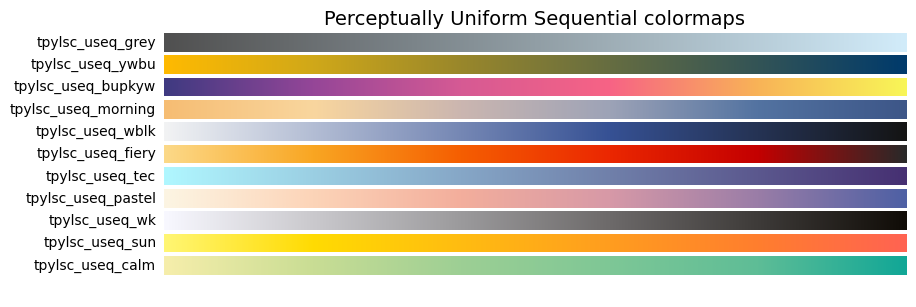
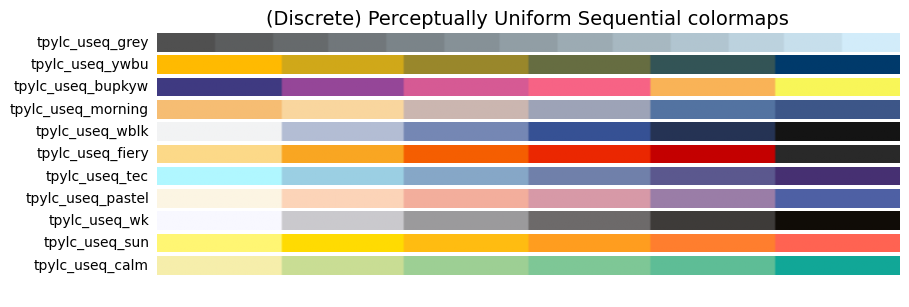
We’ll classify the colourmaps into three different categories: (1)Radar-related colourmaps, (2) Diverging colourmaps and (3) Perceptually Uniform Sequential colourmaps.
The colourmaps within all three categories will be shown in continuous and discrete colour scales. The continuous scale allows for seeing more significant variance in the data. In contrast, the discrete scale helps make out more challenging patterns to see.
# Create a list of Radar-related colourmaps
tp_rad_lsc = [i for i in tpcm if 'rad' in i and 'lsc' in i]
tp_rad_lc = [i for i in tpcm if 'rad' in i and 'lc' in i]

# Create a list of Diverging colourmaps
tp_div_lsc = [i for i in tpcm if 'div' in i and 'lsc' in i]
tp_div_lc = [i for i in tpcm if 'div' in i and 'lc' in i]

# Create a list of Perceptually Uniform Sequential colourmaps
tp_unfseq_lsc = [i for i in tpcm if 'useq' in i and 'lsc' in i]
tp_unfseq_lc = [i for i in tpcm if 'useq' in i and 'lc' in i]
Note that reversed versions of each of the colourmaps are available. The reversed versions of the colourmaps contain the _r suffix on their name.
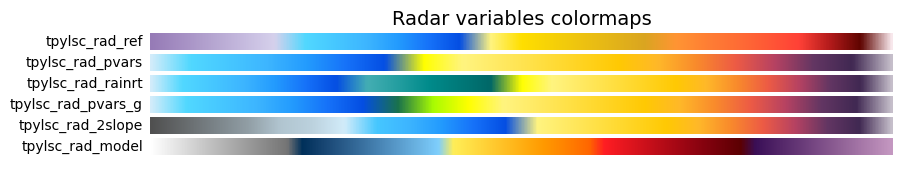
# Plot the colourmaps related to radar variables.
tp.datavis.tpy_cm.plot_color_gradients('Radar variables',
tp_rad_lsc[:int(len(tp_rad_lsc)/2)])
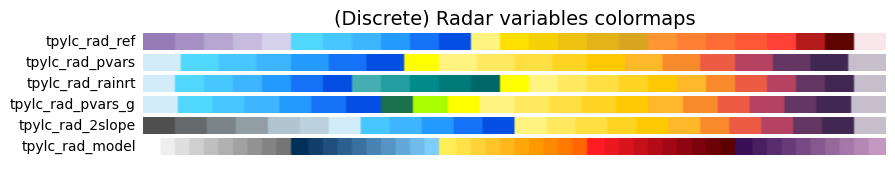
tp.datavis.tpy_cm.plot_color_gradients('(Discrete) Radar variables',
tp_rad_lc[:int(len(tp_rad_lc)/2)])
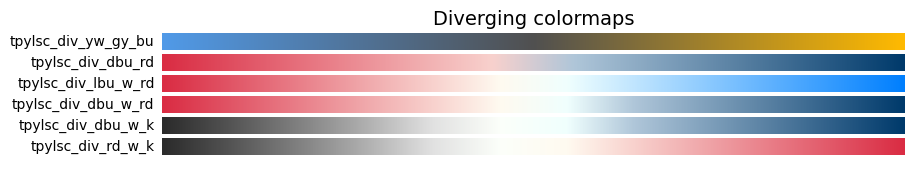
# Plot the diverging colourmaps.
tp.datavis.tpy_cm.plot_color_gradients('Diverging',
tp_div_lsc[:int(len(tp_div_lsc)/2)])
tp.datavis.tpy_cm.plot_color_gradients('(Discrete) Diverging',
tp_div_lc[:int(len(tp_div_lc)/2)])
# Plot the sequential colourmaps.
tp.datavis.tpy_cm.plot_color_gradients('Perceptually Uniform Sequential',
tp_unfseq_lsc[:int(len(tp_unfseq_lsc)/2)])
tp.datavis.tpy_cm.plot_color_gradients('(Discrete) Perceptually Uniform Sequential',
tp_unfseq_lc[:int(len(tp_unfseq_lc)/2)])
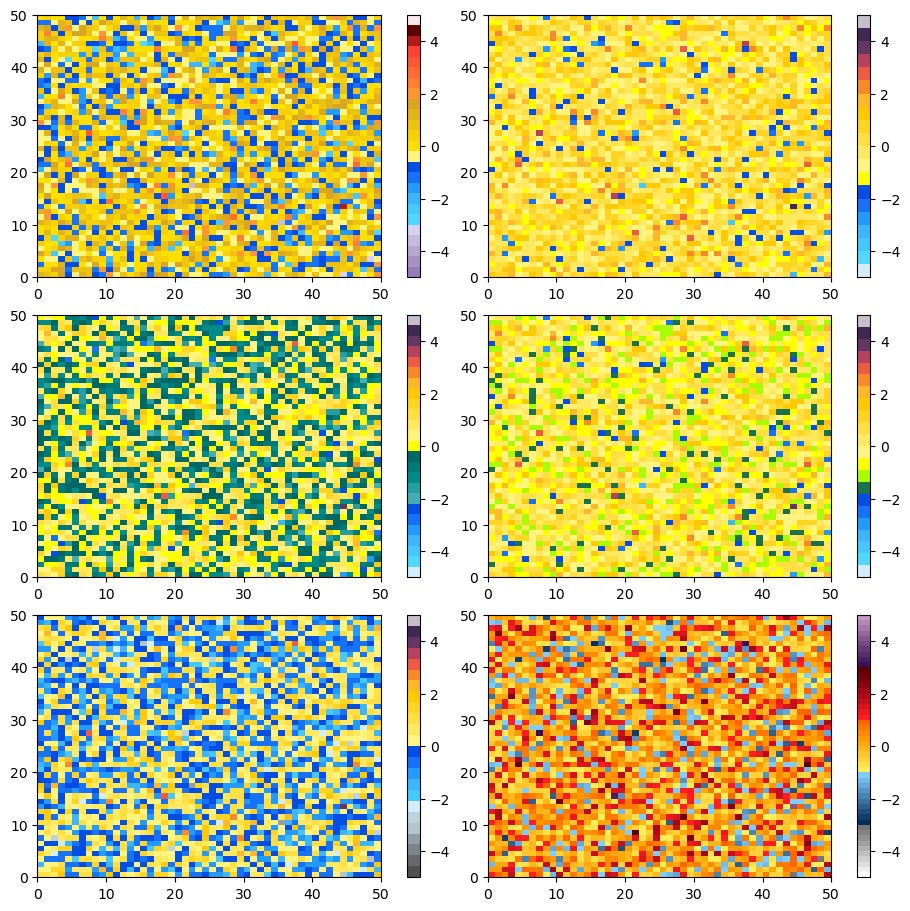
We can also use the plot_examples function to plot a given colourmap using random values.
cm2plot = tp_rad_lc

tp.datavis.tpy_cm.plot_examples(cm2plot[:int(len(cm2plot)/2)])