
How-to: Compute Range-Defined Quasi-Vertical Profiles.#
Daniel Sanchez-Rivas1 and Miguel A. Rico-Ramirez1
1Department of Civil Engineering, University of Bristol, Bristol, BS8 1TR, United Kingdom
This notebook describes the process for generating RD-QVPs (adapted from the methodology proposed by Tobin, D. M. and Kumjian, M. R., 2017).
Import relevant packages#
import datetime as dt
import os
import numpy as np
import towerpy as tp
import cartopy.crs as ccrs
from tqdm import tqdm

# %matplotlib ipympl
---------------------------------------------------------------------------
ModuleNotFoundError                       Traceback (most recent call last)
Cell In[1], line 3
      1 import datetime as dt
      2 import os
----> 3 import numpy as np
      4 import towerpy as tp
      5 import cartopy.crs as ccrs

ModuleNotFoundError: No module named 'numpy'
Define working directory, radar site and other parameters#
RSITE = 'dudwick'
WDIR = '../../../datasets/ukmo-nimrod/data/single-site/2020/'

plot_methods = False
We’ll need a list containing the path and names of the files corresponding to each elevation used to compute the RD-QVPs.
SCANS_ELEVS = ['spel1', 'spel2', 'spel3', 'spel4']
# SCANS_ELEVS = ['lpel1', 'lpel2', 'lpel3', 'lpel4']

lfiles_elevs = [f'{WDIR}{RSITE}/spel1/metoffice-c-band-rain-radar_dudwick_202010031811_raw-dual-polar-augzdr-sp-el1.dat',
                f'{WDIR}{RSITE}/spel2/metoffice-c-band-rain-radar_dudwick_202010031811_raw-dual-polar-augzdr-sp-el2.dat',
                f'{WDIR}{RSITE}/spel3/metoffice-c-band-rain-radar_dudwick_202010031810_raw-dual-polar-augzdr-sp-el3.dat',
                f'{WDIR}{RSITE}/spel4/metoffice-c-band-rain-radar_dudwick_202010031810_raw-dual-polar-augzdr-sp-el4.dat'
               ]
We initialise one towerpy object per each elevation scan.#
# Initialise the towerpy's objects.
rdata = [tp.io.ukmo.Rad_scan(i, RSITE) for i in lfiles_elevs]

# Read-in the data
[robj.ppi_ukmoraw(exclude_vars=['W [m/s]', 'SQI [-]', 'CI [dB]'])
 for c, robj in enumerate(rdata)]

# Create a georeference grid for each object.
[robj.ppi_ukmogeoref() for c, robj in enumerate(rdata)]
[None, None, None, None]
Computation of the Signal-to-Noise-Ratio#
We use the signalnoiseratio function to compute the Signal-to-Noise-Ratio (SNR) (in dB) and discard data using a reference noise value.
rsnr = [tp.eclass.snr.SNR_Classif(robj) for robj in rdata]
[robj.signalnoiseratio(rdata[c].georef, rdata[c].params, rdata[c].vars,
                       min_snr=55, data2correct=rdata[c].vars,
                       plot_method=plot_methods)
 for c, robj in enumerate(rsnr)]
[None, None, None, None]
Clutter classification#
As we are working with low-elevation scans, we use the clutter_id function to identify clutter echoes. This function is based on the methodology proposed by Rico-Ramirez, M. A. and Cluckie, I. D., 2008.
rnme = [tp.eclass.nme.NME_ID(robj) for robj in rsnr]
[robj.clutter_id(rdata[c].georef, rdata[c].params, rsnr[c].vars,
                 binary_class=159, data2correct=rsnr[c].vars,
                 plot_method=plot_methods)
 for c, robj in enumerate(tqdm(rnme, desc='NME_ID'))]
NME_ID: 100%|█████████████████████████████████████████████████████████████████████████████████████████| 4/4 [00:00<00:00, 12.01it/s]
[None, None, None, None]
RD-QVPs computation#
We use the pol_rdqvps function to compute the RD-QVPs. For this function, we set spec_range=25. This is the specified range (from the radar) from which all elevation data will be confined within the cylindrical volume.
Note that this and other parameters can be modified in this function:
help(tp.profs.polprofs.PolarimetricProfiles.pol_rdqvps)
Help on function pol_rdqvps in module towerpy.profs.polprofs:

pol_rdqvps(self, rscans_georef, rscans_params, rscans_vars, r0=None, valid_gates=30, thlds='default', power_param1=0, vert_res=2, power_param2=2, spec_range=50, all_desc=True, exclude_vars=['V [m/s]'], qvps_height_method='bh', plot_method=False)
    Generate RD-QVPs of polarimetric variables.

    Parameters
    ----------
    rscans_georef : list
        List of dicts containing the georeference of the PPI scans.
    rscans_params : list
        List of dicts containing Radar technical details.
    rscans_vars : list
        List of dicts containing radar variables used to generate the
        RD-QVPs.
    r0 : float or list of floats, optional
        Initial range within the PPI scans to build the QVPS, in km.
        The default is None.
    valid_gates : int, optional
        Number of valid gates (or azimuths) along the radial.
        The default is 30, according to [1]_.
    thlds : dict containing 2-element tuple, optional
        Thresholds [min, max] of radar variables used to discard gates
        in the azimuthal averaging. The default are: ZH [dBZ] > -10 and
        rhoHV > 0.6, according to [1]_.
    power_param1 : float, optional
        Power parameter for :math:`r_i \leq d-1`. The default is 0,
        according to [2]_.
    vert_res : float, optional
        Resolution of the common vertical axis, in m. The default is 2.
    power_param2 : float, optional
        Power parameter for :math:`r_i > d-1`. The default is 2,
        according to [2]_.
    spec_range : int, optional
        Range from the radar within which the data will be used.
        The default is 50.
    all_desc : bool, optional
        If False, the function provides descriptors using an average of
        datetime and elevations and will not give the initial QVPs used
        to compute the RD-QPVs. The default is True.
    exclude_vars : list, optional
        Name of the variables that will not be used to compute the QVPs.
        The default is ['V [m/s]'].
    qvps_height_method : str, optional
        'bh' or 'vr'
    plot_method : bool, optional
        Plot the RD-QVPS. The default is False.

    Returns
    -------
    None.

    References
    ----------
    .. [1] Ryzhkov, A. V. et al. (2016)
        ‘Quasi-vertical profiles-A new way to look at polarimetric
        radar data’,
        Journal of Atmospheric and Oceanic Technology, 33(3), pp. 551–562.
        https://doi.org/10.1175/JTECH-D-15-0020.1
    .. [2] Tobin, D. M., & Kumjian, M. R. (2017). Polarimetric Radar and
        Surface-Based Precipitation-Type Observations of Ice Pellet to
        Freezing Rain Transitions, Weather and Forecasting, 32(6),
        2065-2082. https://doi.org/10.1175/WAF-D-17-0054.1
    .. [3] Griffin, E. M., Schuur, T. J., & Ryzhkov, A. V. (2018).
        A Polarimetric Analysis of Ice Microphysical Processes in Snow,
        Using Quasi-Vertical Profiles, Journal of Applied Meteorology and
        Climatology, 57(1), 31-50. https://doi.org/10.1175/JAMC-D-17-0033.1
rdqvps = tp.profs.polprofs.PolarimetricProfiles(rnme)
rdqvps.pol_rdqvps([i.georef for i in rdata], [i.params for i in rdata],
                  [i.vars for i in rnme],
                  spec_range=25, plot_method=True)
rdqvps.site_name=RSITE
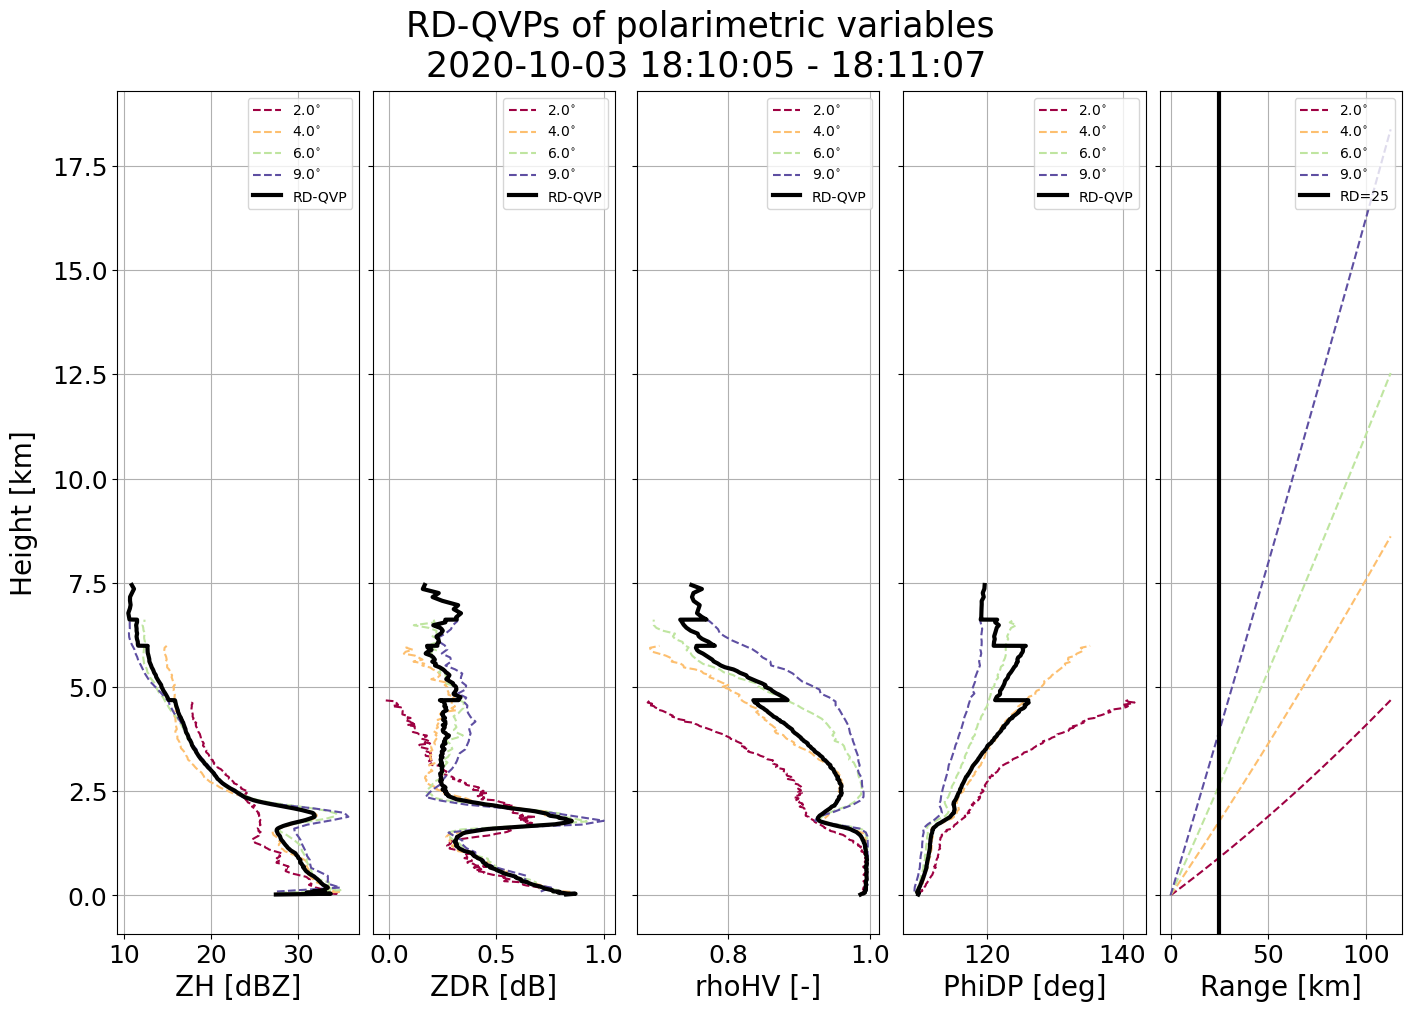
RD-QVPs can be used (among many other applications) as input for the melting layer detection algorithm!
Melting layer height detection#
We’ll run the method proposed by Sanchez-Rivas, D. and Rico-Ramirez, M. A. (2021) to detect the signatures of the ML within the RD-VPs.
rmlyr = tp.ml.mlyr.MeltingLayer(rdqvps)
rmlyr.ml_detection(rdqvps, min_h=0.25, comb_id=14, param_k=0.1, plot_method=True)
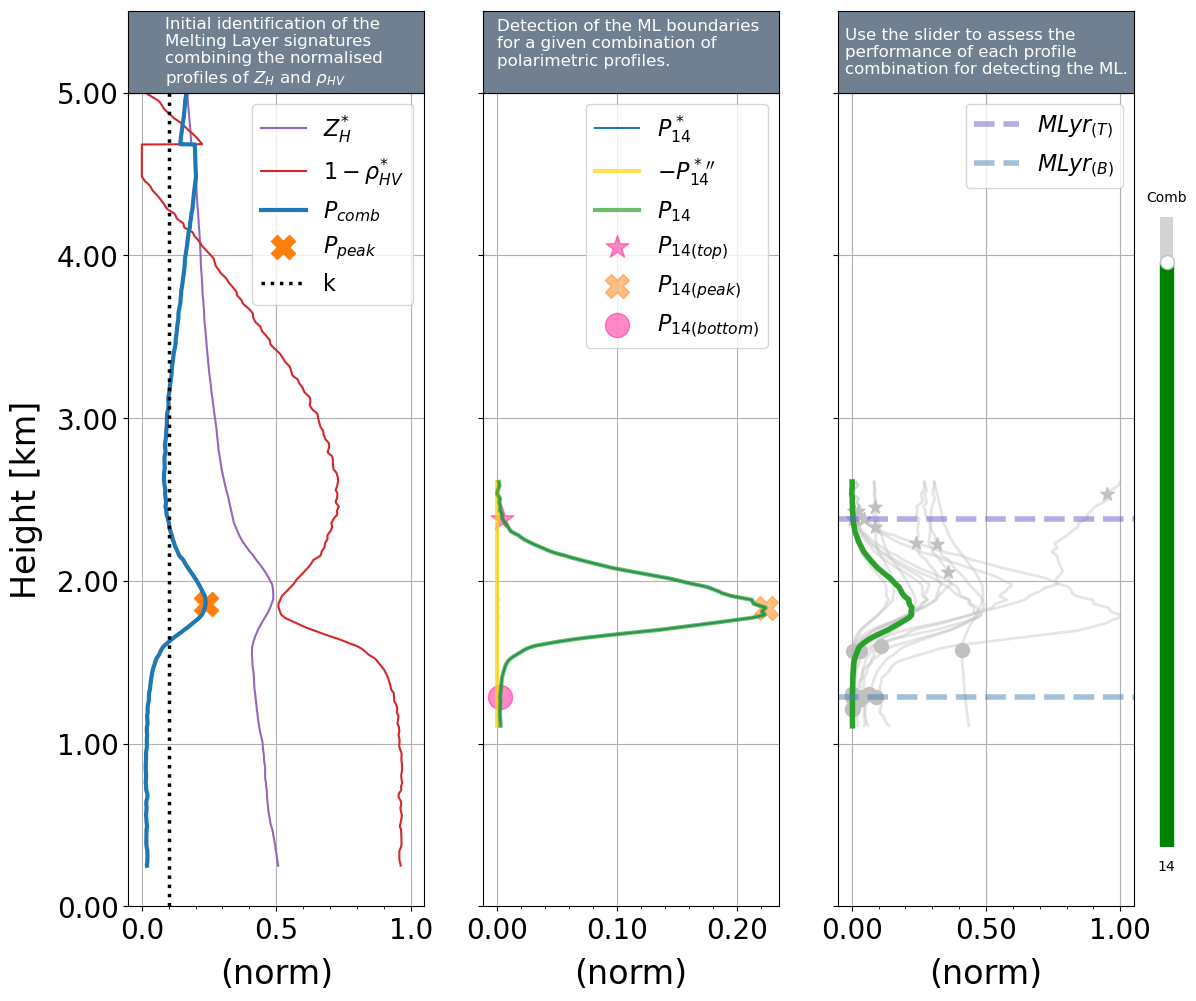
rmlyr.ml_top
np.float64(2.382)
rmlyr.ml_bottom
np.float64(1.286)
References#
[1] Met Office (2003): Met Office Rain Radar Data from the NIMROD System. NCAS British Atmospheric Data Centre, 2022. http://catalogue.ceda.ac.uk/uuid/82adec1f896af6169112d09cc1174499
[2] Rico-Ramirez, M. A., & Cluckie, I. D. (2008). Classification of ground clutter and anomalous propagation using dual-polarization weather radar. IEEE Transactions on Geoscience and Remote Sensing, 46(7), 1892-1904. https://doi.org/10.1109/TGRS.2008.916979
[3] Sanchez-Rivas, D. and Rico-Ramirez, M. A. (2021), “Detection of the melting level with polarimetric weather radar” in Atmospheric Measurement Techniques Journal, Volume 14, issue 4, pp. 2873–2890, 13 Apr 2021 https://doi.org/10.5194/amt-14-2873-2021
[4] Tobin, D. M., & Kumjian, M. R. (2017). Polarimetric Radar and Surface-Based Precipitation-Type Observations of Ice Pellet to Freezing Rain Transitions, Weather and Forecasting, 32(6), 2065-2082. https://doi.org/10.1175/WAF-D-17-0054.1